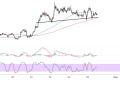
Binance Coin has been consolidating within a symmetrical triangle pattern on the short-term chart, with price currently trading at $607.8 as it approaches the triangle’s apex. This pattern typically indicates a period of indecision before a significant breakout in either direction.
The upper resistance trendline connects lower highs from the $620 region, while the lower support trendline links higher lows starting from the $590 area. As price compresses between these converging trendlines, traders should prepare for increased volatility in the coming days.
Binance Coin Decision Point
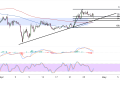
Looking at key moving averages, the blue 100 SMA remains above the red 200 SMA, suggesting that the path of least resistance is still to the upside. Price is currently trading above both indicators, which could provide dynamic support on pullbacks. However, the narrowing gap between these moving averages warrants caution, as a bearish crossover could signal a shift in momentum.
Potential support levels include the lower triangle boundary near $604, followed by the 100 SMA at approximately $603. If these levels fail to hold, BNB could test deeper support around $595-$590.

The stochastic oscillator in the lower panel shows Binance Coin approaching overbought territory above the 80 level, suggesting bullish momentum may be waning. Traders should watch for potential divergence or a turn lower from this indicator, which could precede a price correction.
The middle panel appears to show an MACD-like indicator hovering near the zero line with minimal directional bias, reflecting the current consolidation phase. The histogram bars are showing slightly positive momentum, but without strong conviction.
BNBUSD Price Targets
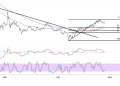
Should Binance Coin break above the triangle resistance around $608-$610, the measured move target would project toward the $625-$630 region. This calculation is based on the height of the triangle formation added to the breakout point.
Conversely, a breakdown below triangle support could trigger a decline toward the $585-$590 zone. Traders should wait for a decisive break with increased volume before establishing positions, as triangle patterns can produce false breakouts.
The current price action suggests accumulation near important technical levels, with market participants likely awaiting catalysts from either broader crypto market developments or Binance-specific news.
The recent Fed’s dovish stance and scaled-down quantitative tightening program could provide tailwinds for crypto assets including BNB, similar to how these factors are influencing other markets as noted in commodity analyses.
In addition, overall market sentiment resulting from trade developments and geopolitical headlines could also impact the crypto sector, especially as altcoins like Binance Coin tend to take cues from bitcoin price action. Anticipation of favorable regulatory developments in the Trump administration are shoring up altcoins for the time being, especially as risk appetite picks up on easing tariffs tensions.
On the other hand, a return in risk aversion in the financial markets could bring downside for Binance Coin as traders flee back to safe-haven assets like bonds and lower-yielding currencies.

