Bitcoin has been showing impressive recovery momentum since forming a bottom in late March and breaking above its long-term descending trendline.
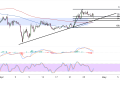
Price action is suggesting a potential continuation of the broader uptrend as a bullish flag pattern is in sight. The cryptocurrency is currently trading around the $94,750 level after successfully breaking above several key Fibonacci retracement levels.
Bitcoin Correction Zones
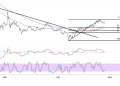
The chart shows that BTC/USD has completed a significant pullback from its earlier downswing, having recovered from the lows near $75,000. After forming what appears to be a double bottom pattern, Bitcoin has rallied strongly and reclaimed territory above the 61.8% Fibonacci retracement level at $83,094.
Price has now pushed beyond the 50.0% retracement at $85,603 and even surpassed the 38.2% Fibonacci level at $88,112, indicating strong bullish momentum.
The current price sits just below the 0.0% Fibonacci level (full retracement) at $96,236, which represents a significant resistance zone that buyers will need to overcome for the rally to extend further.

BTCUSD Technical Indicators
The moving average picture has improved considerably, with the price now trading above both the 100 SMA and 200 SMA, confirming that the path of least resistance is to the upside. The 100 SMA has crossed above the 200 SMA, indicating that the reversal is about to pick up from here while the gap between the indicators is widening.
Looking at the oscillators, the stochastic indicator is retreating from overbought territory but hasn’t shown a decisive bearish crossover yet, suggesting that while the rally might be losing some steam, sellers haven’t taken control. This could indicate a period of consolidation before the next directional move.
Meanwhile, the MACD (displayed at the bottom of the chart) shows bullish momentum still in play, with the MACD line maintaining position above the signal line, though the histogram appears to be contracting slightly, which might signal some weakening in the immediate bullish momentum.
Should Bitcoin push through the $96,236 resistance level, it could target the previous high near $100,000, with potential for a move toward the December 2024 highs around $109,800.
However, if buyers fail to sustain momentum at current levels, a retracement could find support at the recently conquered Fibonacci levels, particularly the 38.2% retracement at $88,112 then the 50% Fib at $85,603 or the 61.8% level at $83,094 closer to the broken trend line that might now hold as a floor.
From a risk management perspective, traders looking to enter long positions might consider waiting for a pullback to the 38.2% Fibonacci level or the 50% level, which could provide better risk-reward entry opportunities while still maintaining the broader bullish bias. A drop below the 61.8% Fibonacci level at $83,094 would warrant caution and could suggest a deeper correction may be underway.
The coming days will be crucial for Bitcoin as it attempts to reclaim the psychologically important $100,000 level, with market participants closely watching for any developments in the crypto regulatory landscape under the Trump administration.


