Bitcoin’s recent price action confirms the bearish sentiment that has been building since its double top formation after making record highs around $110,000. After breaking below the critical neckline support around $93,500, BTC/USD has continued its downward trajectory, currently trading near the $77,425 mark.
The daily chart reveals a clear breakdown of the bullish momentum that carried Bitcoin to its December 2024 highs. Price is now testing significant support levels while key technical indicators suggest further downside potential before any sustainable recovery.
Key Bitcoin Levels to Watch
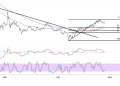
The Fibonacci retracement tool applied to the recent decline shows several critical resistance levels that could cap any recovery attempts:
- The 38.2% Fibonacci retracement level at $87,259 has already rejected the price during the most recent rally attempt
- The psychologically important 50% retracement at $80,040 acted as temporary support before giving way
- Price is currently hovering near the 61.8% Fibonacci level at $72,821, which represents the last line of defense before a potential drop to the 100% retracement at $49,450
These Fibonacci levels will likely serve as key resistance zones during any corrective bounces.
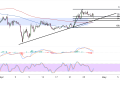
In addition, bitcoin’s price structure reveals several key levels to monitor:
- The area between $93,500-$97,000 represents formidable resistance (previous neckline support turned resistance)
- The zone around $77,000-$78,000 provides immediate support
- The long-term ascending trendline connecting lows since mid-2023 comes in near the current price level, making this a critical juncture

BTCUSD Technical Analysis
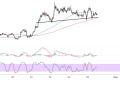
The moving average configuration signals deteriorating momentum:
- The 100-day SMA is currently above the 200-day SMA, indicating that some bullish bias remains in the longer-term picture
- However, the narrowing gap between these two moving averages suggests an imminent bearish crossover
- Price is trading below both major moving averages, confirming the bearish control of the medium-term trend
This MA structure typically precedes extended downside moves, especially if the price fails to reclaim position above the 100-day SMA.
Oscillator Readings
The technical oscillators provide mixed but predominantly bearish signals:
- The Stochastic oscillator is declining from recently overbought conditions, indicating weakening bullish momentum
- The MACD is below the signal line and trending lower, supporting the bearish case
- Histogram bars are shifting into negative territory, suggesting increasing selling pressure
These readings align with the view that any short-term rallies are likely to be selling opportunities rather than the start of a sustainable recovery. A decisive break below the long-term trendline would confirm that the bearish reversal is more than just a correction within the broader uptrend.
Bitcoin Price Outlook
Bitcoin appears poised for continued weakness in the near term. While the longer-term uptrend remains technically intact on the weekly timeframe, the daily chart shows clear distribution patterns. Traders should watch for potential reversal candlesticks at Fibonacci resistance levels as selling opportunities.
For bulls to regain control, Bitcoin would need to reclaim position above the 38.2% Fibonacci level at $87,259 and the 100-day SMA. Until then, the path of least resistance remains to the downside, with potential targets at $72,000 followed by $65,000 should current support fail.
The sentiment around cryptocurrency markets may continue to be influenced by expectations regarding the Trump administration’s approach to digital assets, though disappointment over the lack of concrete policy details appears to be weighing on prices in the immediate term.

