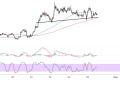
Solana has been trading in a consolidation pattern around the $147.50 level, which appears to be a significant horizontal support zone that has held multiple times since late March.
After reaching recent highs near $155, SOL has shown signs of a potential short-term downtrend, though the price is currently finding buyers at this crucial support area. A break below what appears to be the neckline of a head and shoulders pattern could confirm the potential drop.
Near-Term Solana Inflection Points
The chart shows SOL bouncing between the support at $147.50 and resistance around $150, forming what appears to be a tight range-bound pattern. This consolidation follows a strong uptrend that began in mid-April from the $130 level, suggesting that the current price action may represent a period of indecision before the next significant move.
Looking at the moving averages, the 100 SMA (blue line) remains above the 200 SMA (red line), indicating that the path of least resistance is still to the upside and the broader bull trend remains intact. The price is currently trading above both moving averages, which should provide dynamic support on any deeper pullbacks.
If the current support level fails to hold, potential Fibonacci retracement levels from the mid-April lows to recent highs would place support around the $141-$143 area (38.2% retracement), with further support at the $138 level (50% retracement) which also coincides with the 100 SMA dynamic support.

Solana Directional Outlook
The stochastic oscillator has recently reached the oversold territory and appears to be forming a bullish crossover, suggesting that bearish momentum may be exhausting and a bounce could be imminent. This aligns with the price action currently respecting the $147.50 support level.
Meanwhile, the MACD indicator (represented by the histogram and dual lines at the chart’s bottom section) shows declining momentum, with the histogram bars shrinking and approaching the zero line. The blue and orange MACD lines are converging, potentially setting up for a bullish crossover if buying pressure returns.
For the bullish scenario to materialize, SOL would need to break above the immediate resistance at $150, followed by a push through the recent swing high near $155. A daily close above these levels could open the path to test the $160-$165 range.
Conversely, a decisive break below the current support at $147.50 could accelerate the decline toward the next major support zones around $141-$143, or even the $138 level where the 100 SMA currently lies. The stochastic oscillator’s position suggests that a bearish scenario might be limited in the short term.
Looking at the broader market context, Solana’s price action appears to be influenced by overall crypto market sentiment and regulatory updates, as well as bitcoin price trends which appear to be taking cues from USD demand and safe-haven positioning.
Traders should watch for reversal candlestick patterns at current levels, as these could indicate the next directional move for Solana in the coming days.


